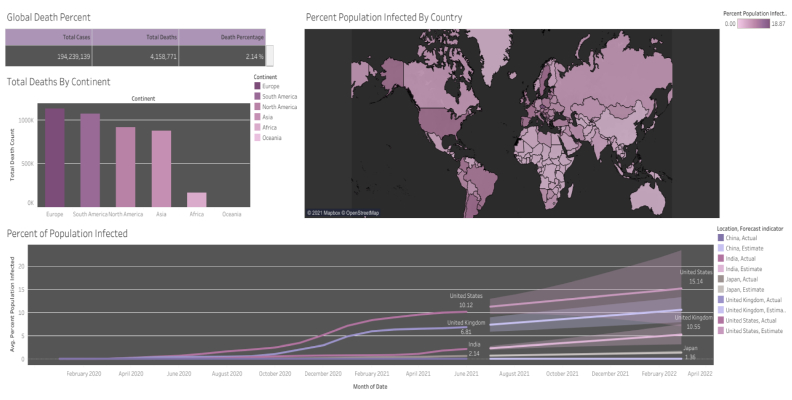
Tableau Projects

Visualizations, Dashboards, Charts, Graphs, and more.

Obesity Model
Dashboard

Data Visualization and Modeling using Tableau.

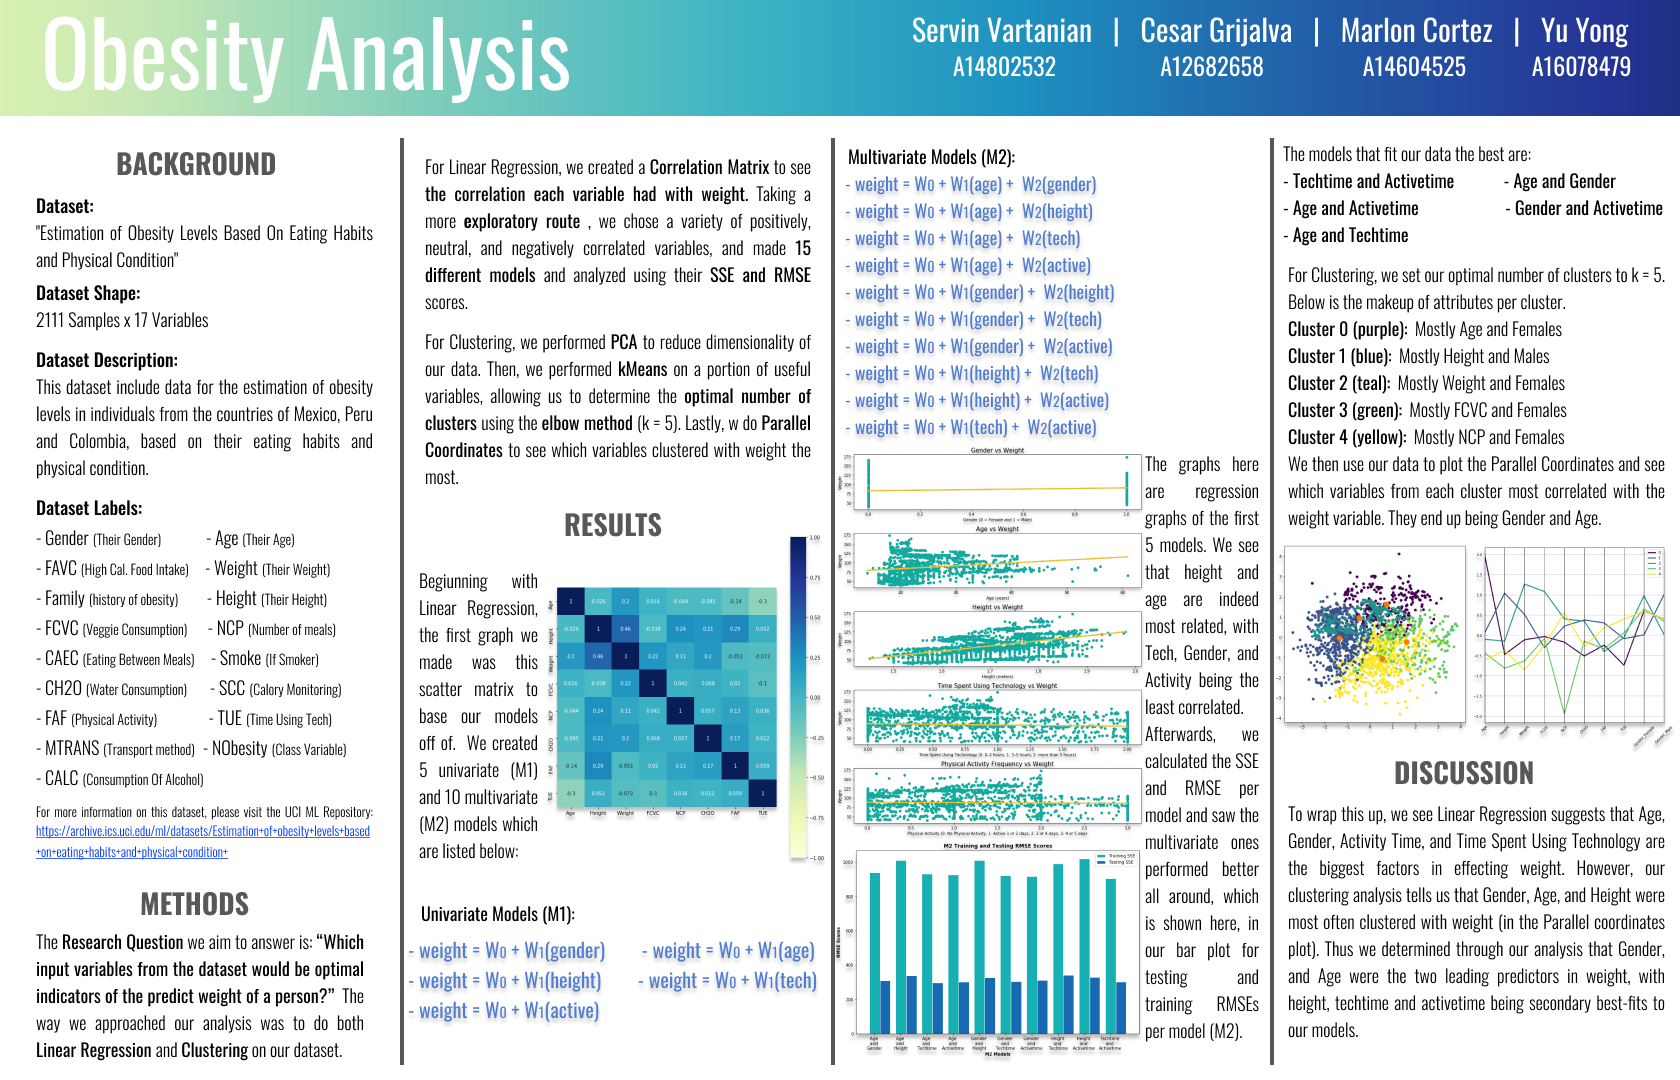
A presentation created using graphs and charts from Python and Tableau, assembled into a comprehensive dashboard showing models, their correlations with attributes, and results.
The python code behind the analysis can be found here and you can read my findings in detail in my Final Report.

COVID-19 Infection
And Death Rate Dashboard

Data Visualized via Interactive Dashboard on Tableau

Using data wrangled from my previous Covid-19 Exploratory Project, I created an interactive and informative visualization detailing the infection rate and death rate of COVID-19 as seen by country, region, and worldwide.